What does the distribution of wealth in the U.S. look like?
QUESTIONS WE CAN ASK OURSELVES:
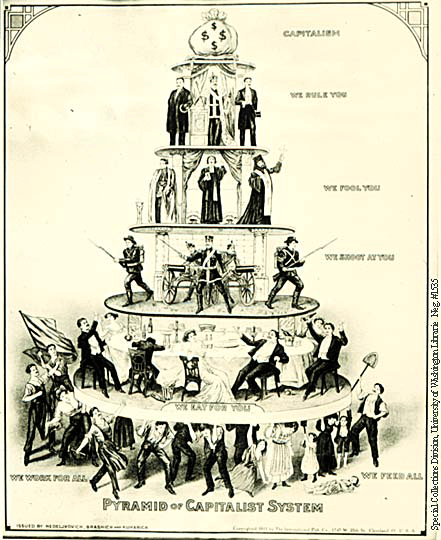
Where did you grow up on the pyramid?
Where are you now? Are you part of any group that has organized for more access to voting rights, jobs, housing, education, health care, an end to violence, gender and/or religious freedom? How have those struggles benefited you and your community? How have those struggles been resisted by the ruling class? For more on how to figure out where you fit on the class pyramid, take a look at Paul Kivel's Where Are You in the Class System? here. |
This short video on the distribution of wealth in the U.S. highlights both the extreme inequality of wealth and the difference between what we think is happening and what is really happening when it comes to the distribution of wealth.
What does this tell us about our economic structure?Much of the information (the text) on this page is adapted from Paul Kivel's website and can be accessed directly here
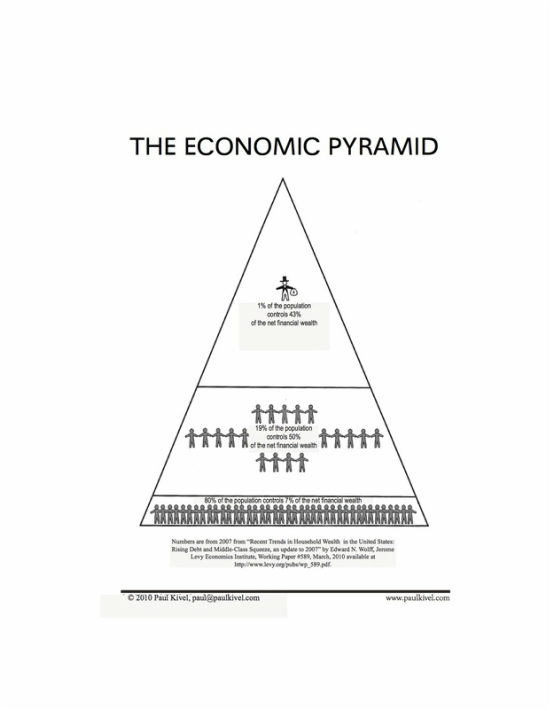
Our economic structure looks like the pyramid to the left.
1% of the people control about 43% of the net financial wealth of the country. Net wealth = everything a person owns (including houses, stocks and bonds, etc. minus any debt. We will call this group THE RULING CLASS because people in this class sit in positions of power - they are corporate executives, politicians, and policy makers; they fund political campaigns, policy research, public policy debates, and media campaigns. They have the power and money to influence and often to determine the decisions that affect our lives, including where jobs will be located, what kinds of jobs they will be, where toxic waste is dumped, how much money goes for schools or prisons, where they will be built, how health care, reproductive and civil rights will be discussed. When we look at positions of power in the U.S., for the most part we will see people from this ruling class. The middle 19% of the people control another 50% of the net financial wealth. We will call this group THE MANAGERIAL CLASS because this is the group that manages the needs of the ruling class. They are large business owners, corporate managers, foundation directors, corporate lawyers, doctors, architects, elite university professors, diplomats, politicians, and others who are paid a lot to carry out policies that benefit the ruling class. This group is mostly white and Christian, although it does include significant numbers of People of Color, Jews, and fairly recent immigrants. Limited access to housing, jobs, health care, and education make it increasingly hard for poor, working, and middle class people to join the managerial class in this historical moment. For more about who makes up the U.S. ruling and managerial classes, go here. 80% of the population struggles to divide up the 7% that is left over. In other words, most of us spend our time trying to earn or get enough money to feed, house, clothe, and support ourselves and our families. A substantial number of people (nearly 20%) aren't even on the chart because they live below the pyramid with negative financial wealth (more debt than assets). |
|
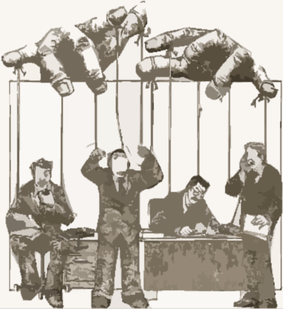
What is a class? A class is a segment of society that shares an economic position as well as cultural values. This class participates in common social, political, and economic interests and shares access or lack of access to power.
What is the ruling class? The ruling class is the segment of society that creates reality for itself and others through control of power and wealth. It can and does determine and control how resources get distributed, who has access to political power, which groups do and don't benefit from the society's policies and practices, which groups are considered central and valuable and which groups are pushed to the margins. Other words to describe this group include: the elite, the power elite, the upper class, the haves, the dominant class, the rich and powerful, the decision-makers, the owning class, and the 1%. Who makes up the ruling class? This group is about 1% of the population, or roughly 3.5 million men, women, and children. They have incomes starting at about $500,000 a year (2013) and/or net worth of at least $4 million. Most are white and most are Christian. While some African-Americans, Asian Americans, Latinos/as, and Arab Americans belong to this class, they are rarely in positions that allow them to control resources and/or determine reality for others. Almost no Indigenous peoples (Native Americans) belong to this group. When we subtract the number of children, women, and men who are wealthy but do not participate in making political, economic, and cultural decisions that impact the rest of us, the group is predominantly white Christian men. They do not meet in a big room all together and decide on financial and social policy or construct social and cultural norms. They might even hold very wide differences of opinion, although these differences generally fall within a narrow range of the political spectrum when it comes to money and financial policy or economic issues. What is the managerial class? The managerial class is made up of those people who are well rewarded for their work on behalf of the ruling class. The ruling class relies on organizations and people (paid and volunteer) from this class to serve its needs. Who makes up the managerial class? This group is about 19% of the population and includes families with incomes above $150,000 and net financial worth of at least $150,000. While they have higher income and own assets, in particular a home, they do not have the wealth necessary to create opportunities, distribute resources, and influence policy-making and cultural norms that the ruling class does. They are large business owners, corporate managers, foundation directors, corporate lawyers, doctors, architects, elite university professors, diplomats, politicians, and others who are generally paid a lot to carry out policies that benefit the ruling class. That said, it is not their occupation, but their high income and wealth and their access to resources that put people in the managerial class. There are many people who manager or supervise others who are not part of the managerial class because they don't share the high level of income or assets that those in the top 19% do. This entire class segment is predominantly white and Christian although it does include a number of People of Color, Jews, fairly recent immigrants, and other groups. However, due to housing segregation, job discrimination, glass ceilings, and the increasing difficulty of getting good health care or a good education if you do not belong to these two top classes, those who are poor, working, and middle class are finding it increasingly hard to join the managerial class. Who is at the bottom of the wealth pyramid? At the bottom of the wealth pyramid are the 80% of the population who are left struggling to divide up the remaining 7% of the economy. These include a distribution of People of Color and white people, Christians, Jews, Muslims, and Buddhists, seniors, middle-aged and youth, people with disabilities, cisgender and gender queer people, lesbians, gays, bisexuals, and heterosexuals. The people with the least power have the least wealth. The people at the very bottom of the pyramid, those with zero or even negative wealth (meaning they are in debt) are primarily children and seniors, People of Color, people with disabilities, recent immigrants, Indigenous peoples, and the poorest white people. |
Taking on the "myths" about our economy ...
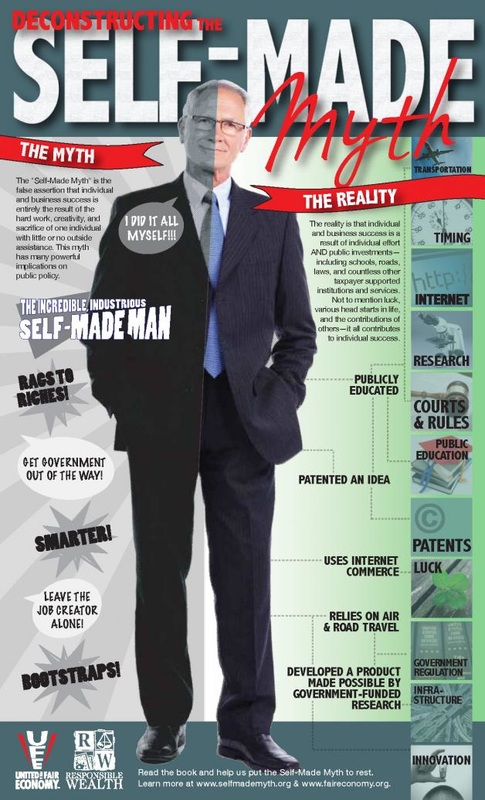
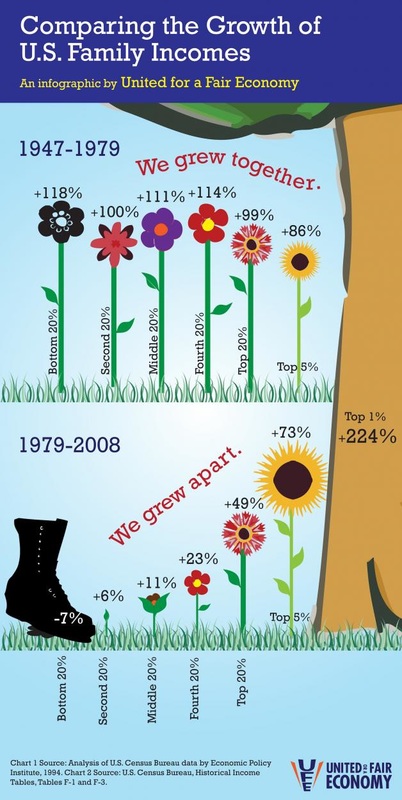
One of the reasons we have such a hard time talking about class in this country is that we all grow up with a shared story about the value of hard work. We're taught early and often that those who are wealthy worked hard and that if people are poor, it's because they don't work hard and/or depend too heavily on handouts. United for a Fair Economy uses popular education, training, and creative communication to challenge this narrative, to teach us what's really happening, and to support social movements working for an economy for all of us. Below are two of their charts; the one on the left takes on the myth of the "self-made" man and the one on the right lets us know that we don't have to be so economically divided; if we look to our history, we can see a period of 3 decades where the economy was more evenly distributed.
|
|
|
Intersections
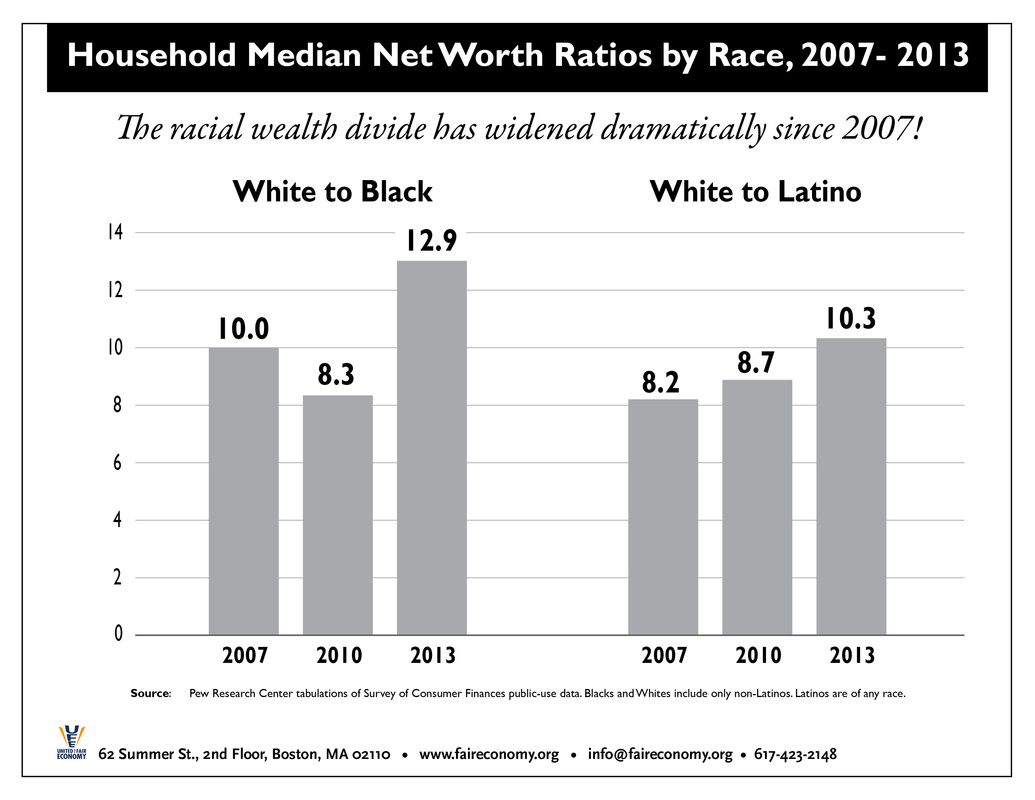
For an article on how It Pays to Be White, click here. The author Jeannette Wicks-Lim notes how "By every socioeconomic measure, there is an undeniable race-based hierarchy in the United States - with Black Americans sitting at or near the bottom. ... If the economic odds are stacked against African-Americans, the flipside is that white Americans have the odds stacked in their favor. We need to even these odds to achieve racial justice." |
|
|
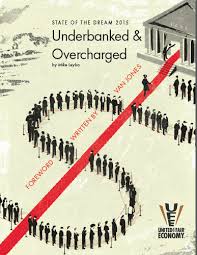
United for a Fair Economy provides a State of the Dream Report every year; their 2015 report Unbanked and Overcharged looks at the banking industry from the perspective of low-wage workers and People of Color, finding that the banking industry underserves over 1 in 5 households (mostly Black, Latino, or Native American) are underserved by the banking industry, costing these families an average of $3,029 each year in fees and interest just to have access to their own money and taking $103 billion each year out of communities that need it most. For a copy of the report, click here. |
|
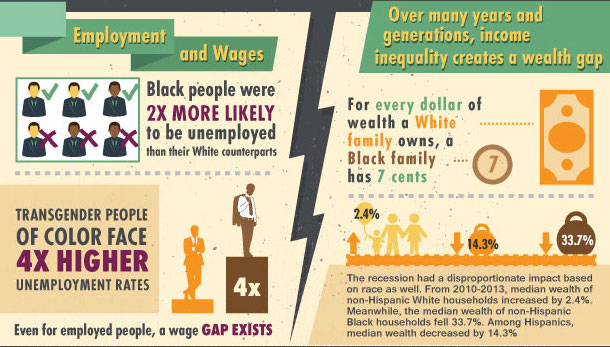
United for a Fair Economy's State of the Dream 2016 highlights the intersections of BlackLives Matter and the economy with a great infographic. For the complete infographic, click here. |
|
ACTIVITY: What are the costs of having an economy run by a Ruling Class?
It took me a long time to put together the puzzle and to be able to see that the concentration of wealth in the current political and economic system is killing us in large numbers every day. ... I mourn the loss of loved ones and grieve with family, friends, and community members for many others. I know some of the casualties. I think that you know some of them too. And everyday, in the newspaper, on the radio, on TV, and over the Internet, we hear about many others killed by the effects of the tremendous inequality of wealth and opportunity in this country and abroad. From Paul Kivel's
You Call This a Democracy? (2004). For the complete essay, see below. |
This list of questions can be used in a group to explore the costs of an economy designed by and for the ruling class. Created by Paul Kivel and adapted from You Call This a Democracy (2004). Paul writes:
Do you know anyone, including yourself, or know of anyone ...
If you cannot answer yes to at least some of these questions, why is that? What do these questions have to do with social class and economics? What kind of economy could transform our answers to these questions? |
|
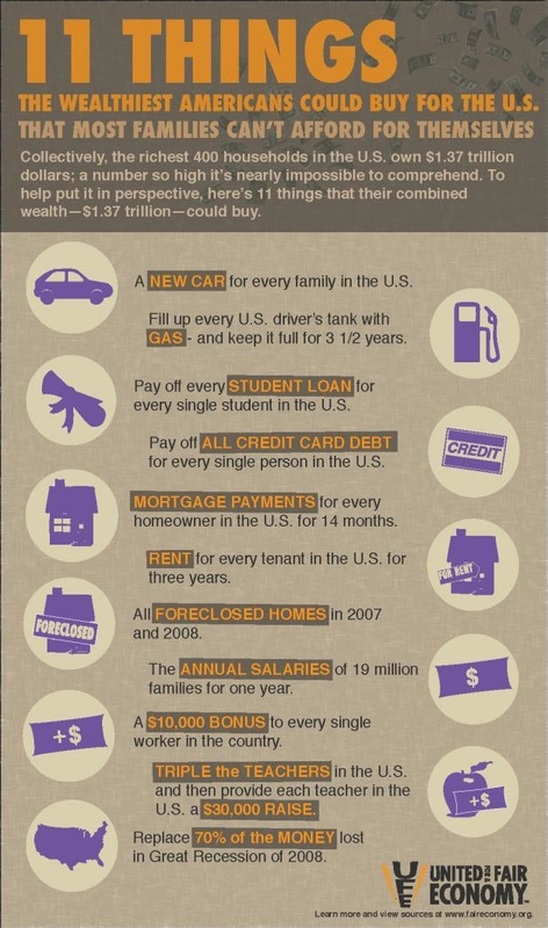
This United for a Fair Economy infographic offers a different vision for how we might create an economy that serves us all. For more UFE infographics, click here.
In this video, Ben Cohen of Ben and Jerry's explains the Federal Budget using Oreo cookies (2012).
This video gives us a global perspective.
|